datashader-cli


Quick visualization of large datasets using CLI based on datashader.
Installation
Use pip
pip install datashader-cli
Use pip from Github
pip install git+https://github.com/wybert/datashader-cli.git
Quick Start
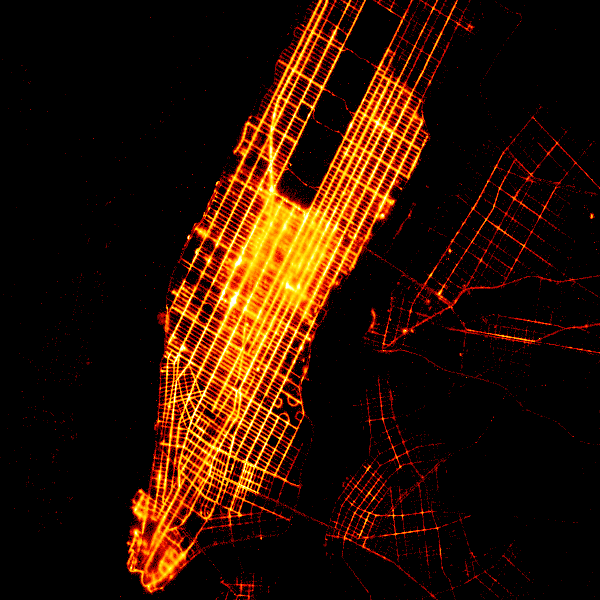
Visualize 10 million NYC taxi trip data points in Gigabytes.
Create a shaded scatter plot of points and save it to png file, set background color to black.
datashader_cli points nyc_taxi.parquet --x pickup_x --y pickup_y pickup-scatter.png --background black
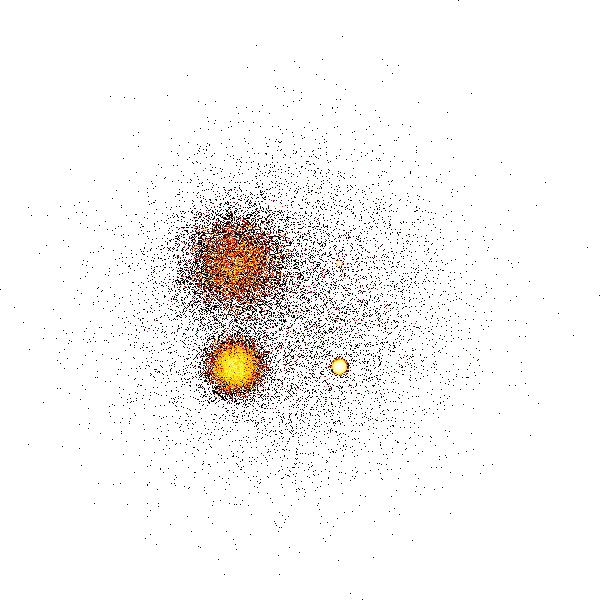
Visualize the geospaital data, support Geoparquet, shapefile, geojson, geopackage, etc.
datashader_cli points data.geo.parquet data.png --geo true
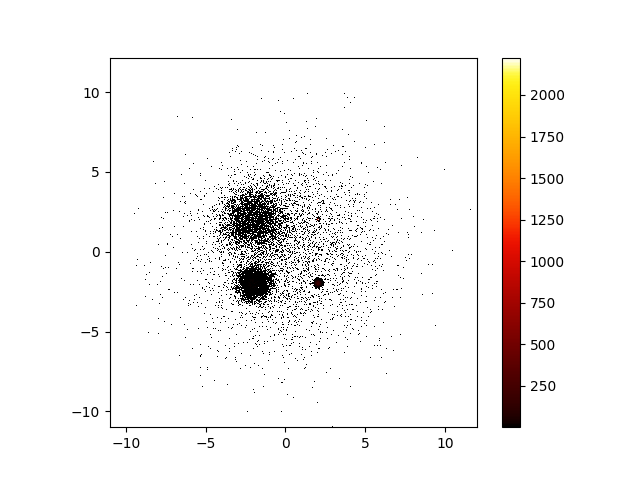
Use matplotlib to render the image, matplotlib will enable the colorbar, but it can’t use spread function
datashader_cli points data.geo.parquet data.png --geo true --matplotlib true
Usage
datashader_cli --help

# sage: datashader_cli [OPTIONS] COMMAND [ARGS]...

#   Quick visualization of large datasets using CLI based on datashader.

#   Supported data format: csv, parquet, hdf, feather, geoparquet, shapefile,
#   geojson, geopackage, etc.

# Options:
#   --help  Show this message and exit.

# Commands:
#   points  Visualize points data.
Quick visualization of large point datasets using CLI based on datashader.
datashader_cli points --help

# Usage: datashader_cli points [OPTIONS] DATA_PATH OUTPUT_APTH

#   Visualize points data.

# Options:
#   --x TEXT              Name of the x column, if geo=True, x is optional
#   --y TEXT              Name of the y column, if geo=True, y is optional
#   --w INTEGER           How many pixels wide to make the image
#   --h INTEGER           How many pixels high to make the image
#   --x_range TEXT        Range of the x axis, in the form of "xmin,xmax"
#   --y_range TEXT        Range of the y axis, in the form of "ymin,ymax"
#   --agg TEXT            Aggregation function, e.g. "mean", "count", "sum", see
#                         datashader docs
#                         (https://datashader.org/api.html#reductions) for more
#                         options
#   --agg_col TEXT        Column to aggregate on, e.g. "value"
#   --by TEXT             Column to group by, e.g. "category", see datashader
#                         docs (https://datashader.org/api.html#reductions) for
#                         more options
#   --spread_px INTEGER   How many pixels to spread points by, e.g. 1, see https
#                         ://datashader.org/api.html#datashader.transfer_functio
#                         ns.spread
#   --how TEXT            How to map values to colors, valid strings are
#                         ‘eq_hist’ [default], ‘cbrt’ (cube root), ‘log’
#                         (logarithmic), and ‘linear’. see https://datashader.or
#                         g/api.html#datashader.transfer_functions.set_backgroun
#                         d
#   --cmap TEXT           Name of the colormap, see https://colorcet.holoviz.org
#                         for more options
#   --geo BOOLEAN         Whether the data is geospatial, if True, x and y are
#                         optional, need Geopandas installed to use this option,
#                         supported data format: Geoparquet, shapefile, geojson,
#                         geopackage, etc.
#   --background TEXT     Background color, e.g. "black", "white", "#000000",
#                         "#ffffff"
#   --matplotlib BOOLEAN  Whether to use matplotlib to render the image, if
#                         True, need matplotlib installed to use this option.
#                         Matplotlib will enable the colorbar, but it can't use
#                         spread function
#   --help                Show this message and exit.
Credits
- Free software: MIT license
- Documentation: https://wybert.github.io/datashader-cli
Features
- point data visualization